
WORLDPROCESSOR: Zones of Invention – Patterns of Patents
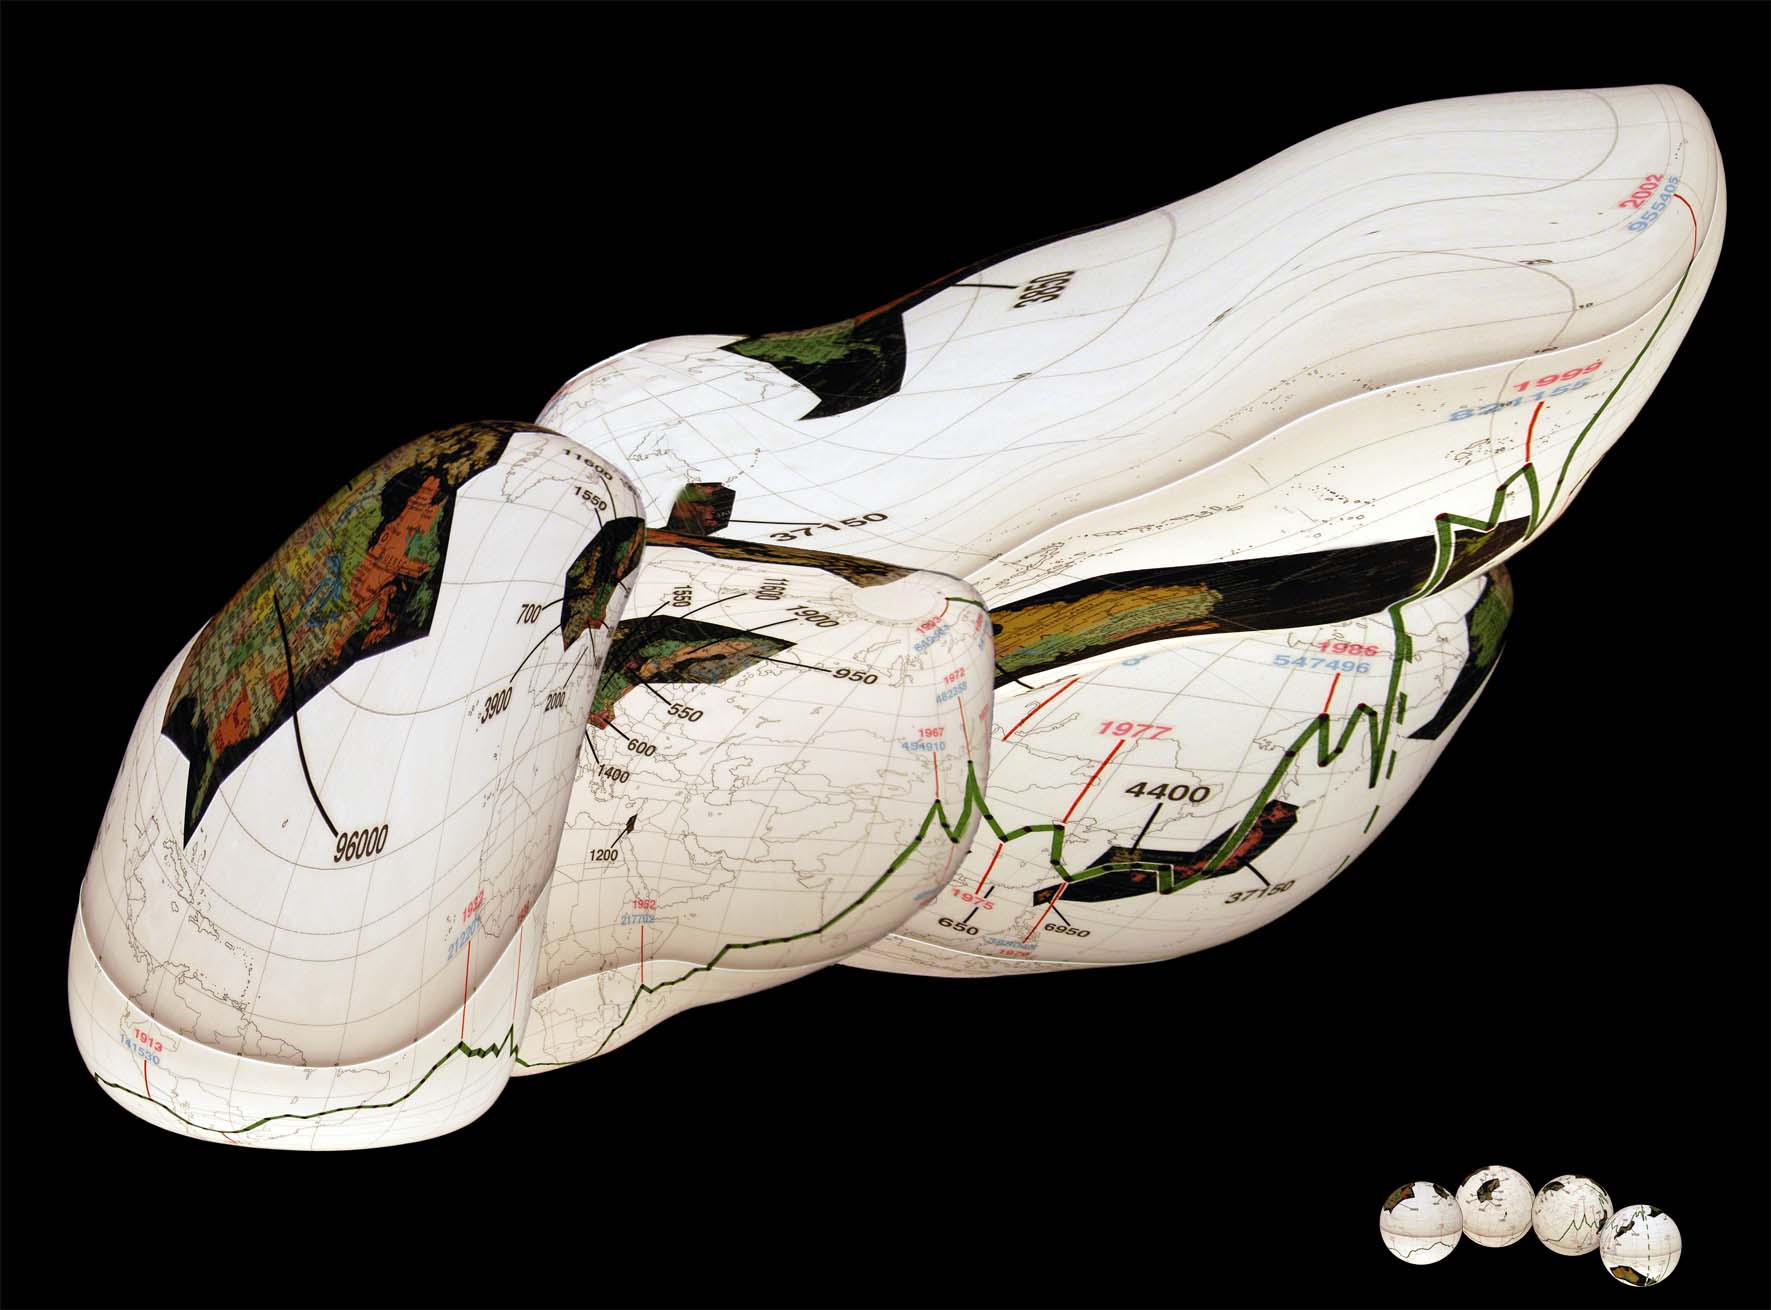
This Worldprocessor-globe based composite image plots the total amount of patents granted worldwide, beginning in 1883 with just under 50,000 and continuing to 2002 on a rapid climb towards 1 million, the x-y parameters of the annually shifting amount of total patents granted worldwide is plotted around a globe by a line graph. Though other cartographically related information distorts as a result, by preserving the plotted line as an uninterrupted constant, an overview of this rapid escalation is derived through the reconstitution of four different perspectives into a single image. Geographic regions where countries offer environments conducive to fostering innovation are represented by topography. Additionally, nations where residents are granted an average of 500 or more US patents per year are called out in red by their respective averages in the years after 2000.
[Research was supported by NSF IIS-0238261 award and Indiana University. It is part of Indiana University’s effort to map science and human knowledge. For more see scientometry.net ]
(download or drag image into a new browser window for a more detailed view, especially if your browser displays a vertically distorted image)